 How to resolve AdBlock issue?
 Nugen Audio Halo Vision
Audio Visualization Tool for Surround and Immersive Audio
Author: Harald Gericke
The real-time audio visualization suite Halo Vision has been available in the Nugen Halo plug-in family since September 2022. It offers seven customizable analysis instruments for the visualizing important audio parameters for surround sound and 3D immersive audio. The focus here is on phase correlation, spectral composition, and spatial localization. We have extensively tested all features.
System Requirements and Installation
Halo Vision is available as a 64-bit plug-in in VST3 and AAX formats for Windows and Mac OS (Intel and Apple Silicon). It is also available as an AudioUnit plug-in. It works with sample rates up to 192kHz. As is standard with Nugen Audio, it supports multi-channel setups up to a maximum of 7.1.4.
The copy protection requires an iLok customer account, and the license includes two activations that can be stoerd either on an iLok dongle or directly on the computer. The license is not compatible with the iLok Cloud.
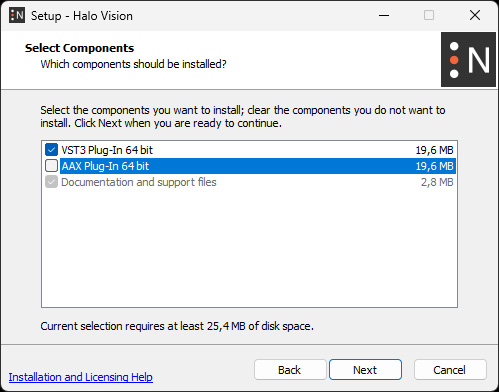
Once log in to the manufacturer's website with your user account, you can download the installer for the plug-in. During installation, you can select the desired plug-in formats and specify the installation paths.
Concept
Nugen Halo Vision is a plug-in that can only be loaded into the VST/AAX/AU slots of a DAW host. A standalone version is not available. If you want to outsource the metering or visualization to a second computer, you must use an additional host on the second computer to load the plug-in.
However, you can also place one or more Halo Vision plug-in windows on a dedicated DAW monitor that is only used for metering and visualization. The plug-in allows multiple instances to be loaded simultaneously, allowing Halo Vision to be used in master or metering buses with different channel formats (e.g., 5.1 and 7.1.4), as well as in source tracks. Similarly, the plug-in can be loaded multiple times on the metering bus with different display options in order to use different individual visualizations within an open project.
Operation
When loading the plug-in into the DAW, the channel format of the slot is usually recognized automatically. If this does not happen correctly, select a possible routing in the plug-in's settings menu (gear icon at the bottom of the plug-in's bottom panel).
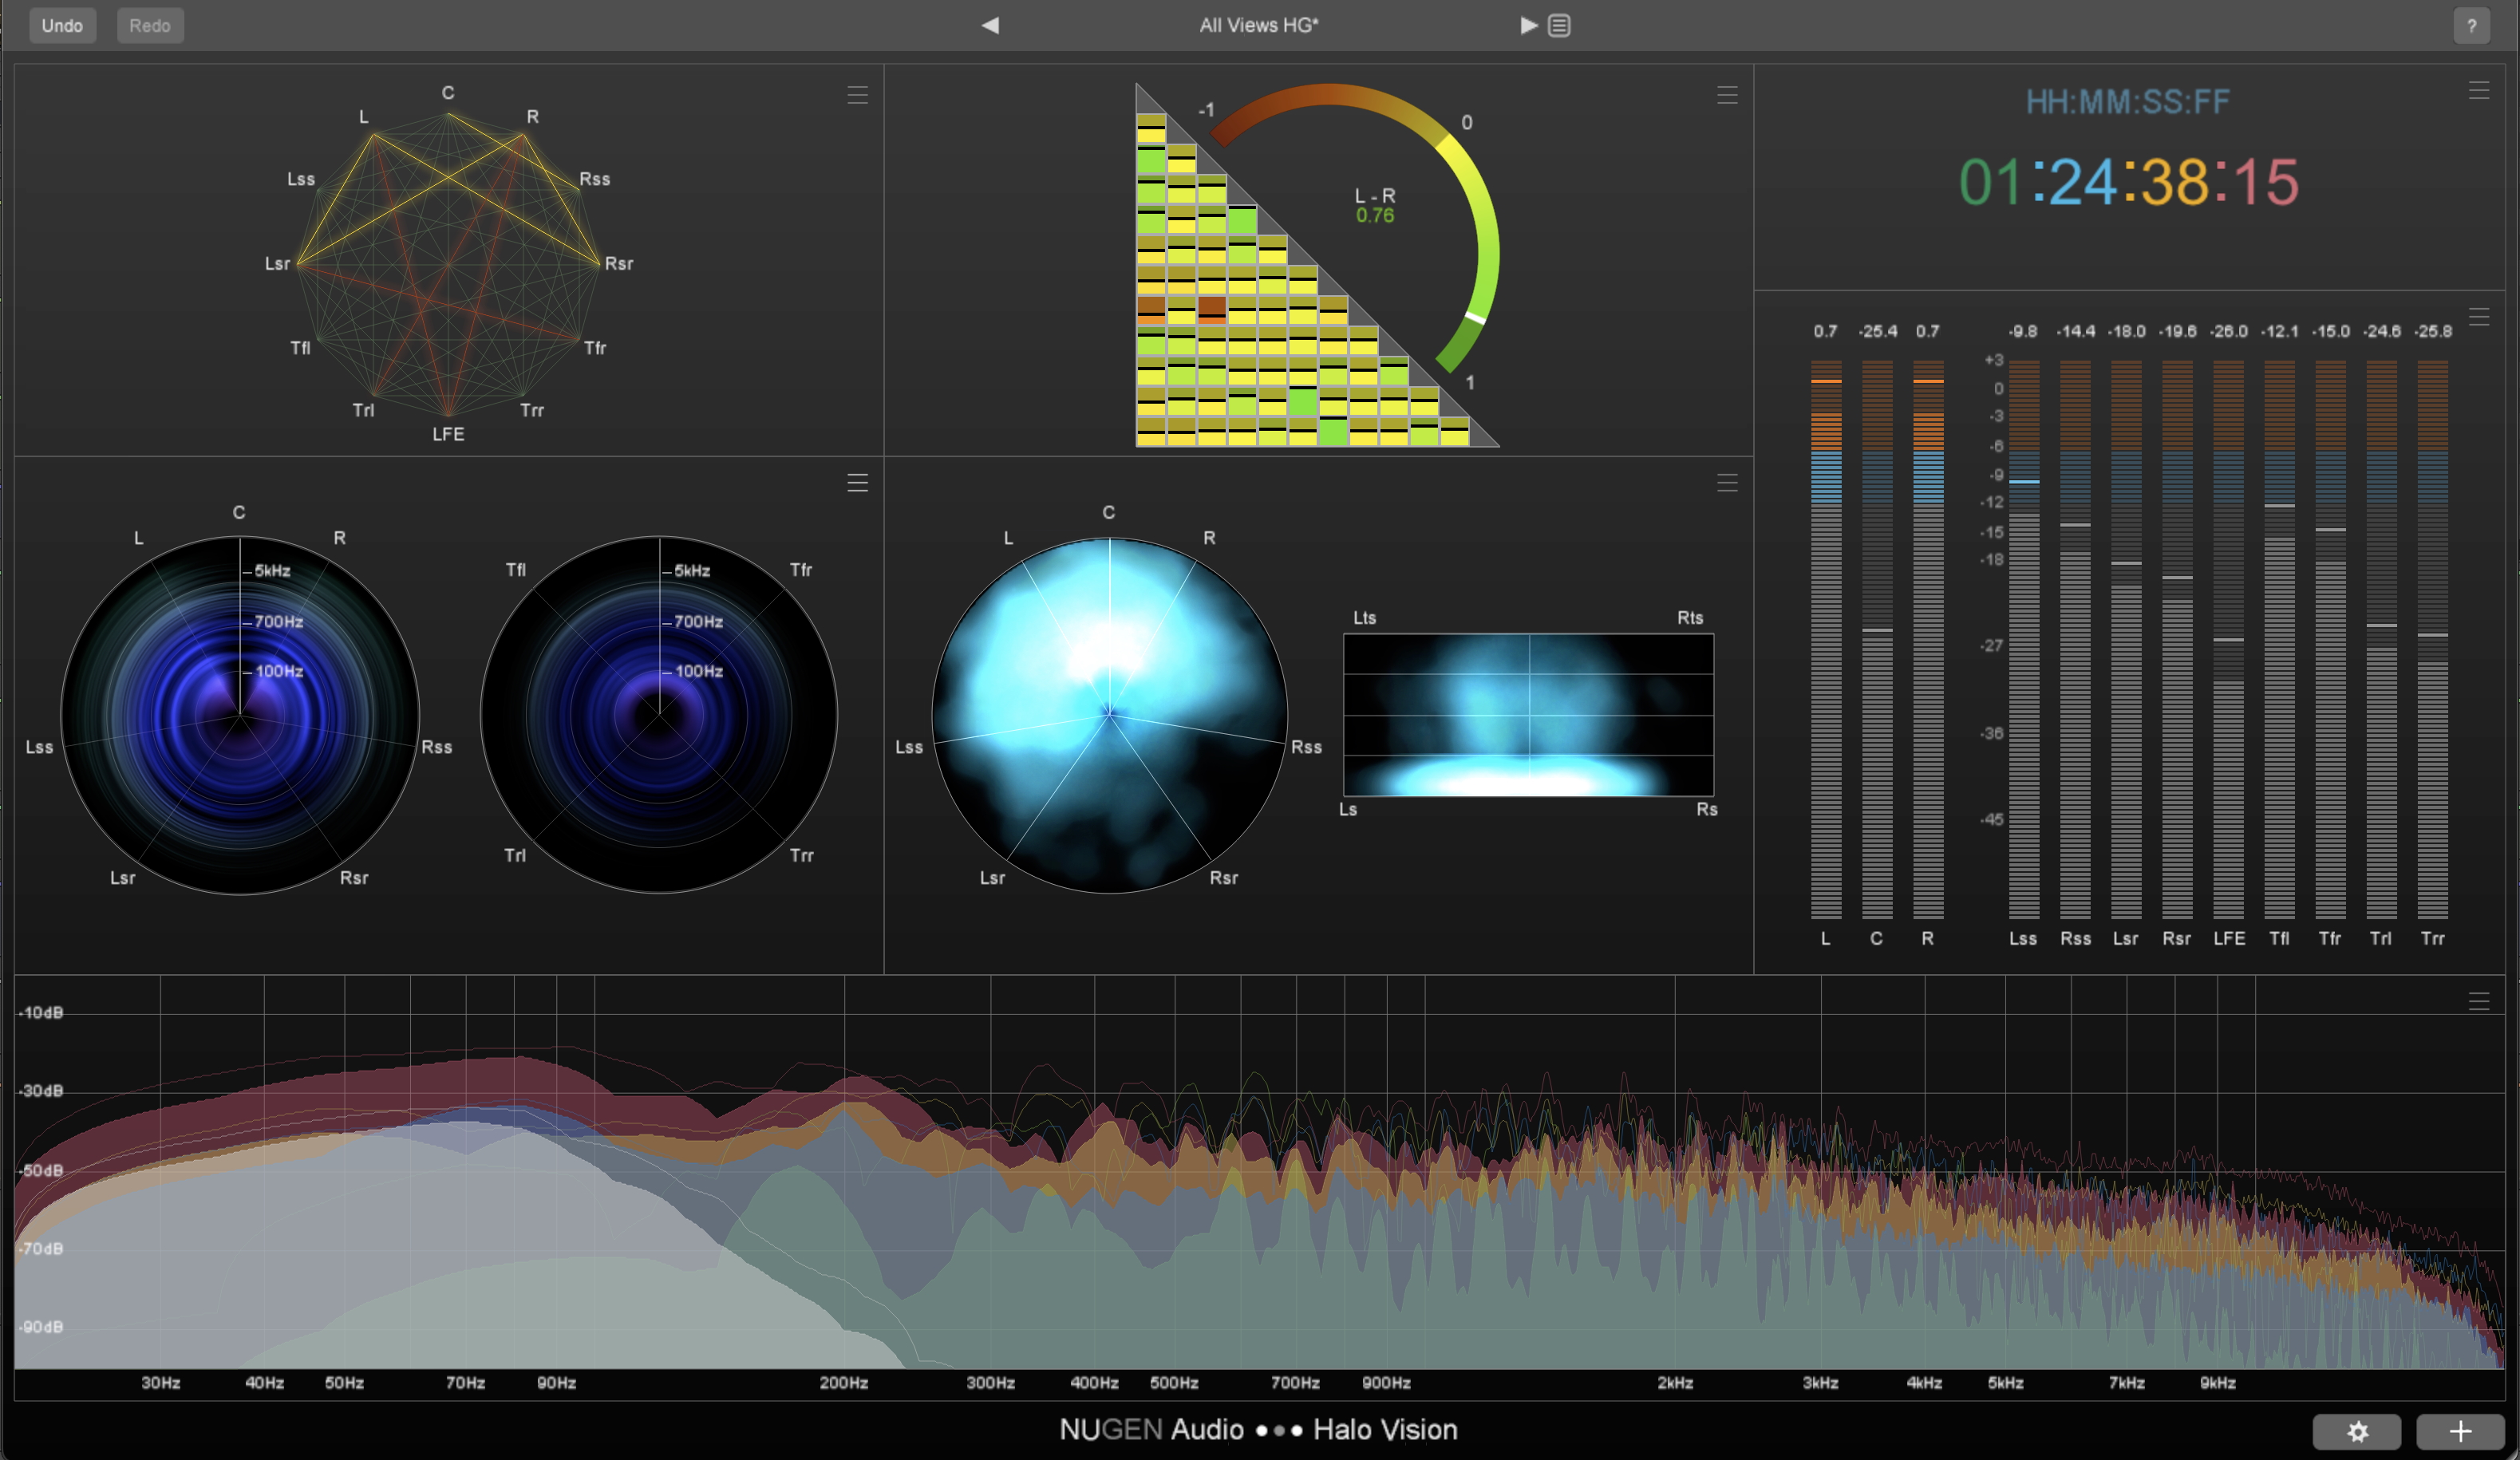
After opening, the continuously scalable interface of the plug-in displays all the different visualization instruments in the “All Views” preset when loaded for the first time (see first image above). In addition to the “All Views” preset, there are other manufacturer presets that focus on specific visualizations, which can be managed at the top of the plug-in header.
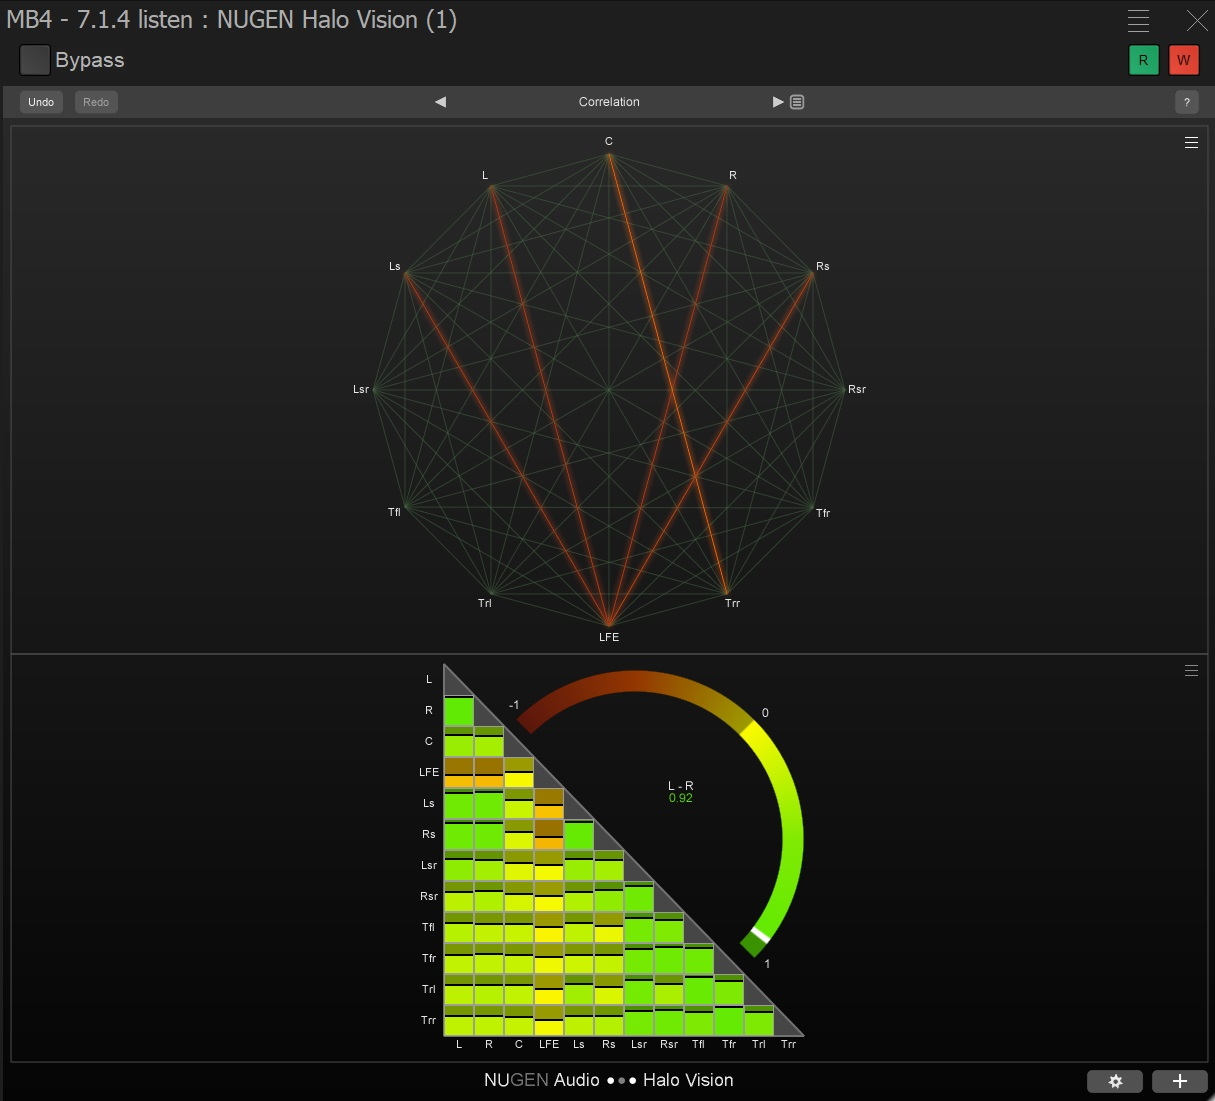
Above, for example, you can see the Correlation preset, which only displays the two correlation modules. The size and arrangement of the individual analysis tools, called "Audio Modules" by Nugen, can be customized according to your needs and saved in your presets. Of course, it is also possible to create your own combination of selected modules that can be used multiple times. To do this, click on the “+” symbol in the bottom panel of the plug-in to display all available tools for selection, which you can then arrange in the plug-in window.
Each module has a special button in the upper right corner that opens the module menu. This allows you to scale the module to the full size of the plug-in window, remove it from the view, or open a dialog with specific settings for the module. The settings allow you to restrict the displayed frequency range or level, select the active channels, and select many other options to suit the modules.
Modules
Let's now take a look at the individual analysis modules. The first of the seven available modules is the Time Code Module, which displays the current timecode of the project's playback position in either frames, milliseconds, or sample count.
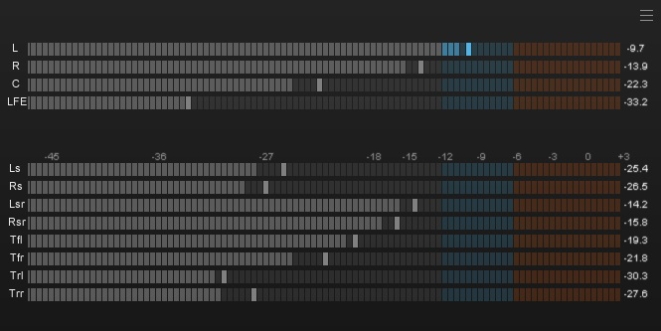
The next module is a peak meter that displays the level of each channel in dB. The display can be switched between True Peak, Sample Peak, and Apple Peak. The displayed range is adjustable between -51dB and +12dB. Peak hold, fallback time, and the colors of the peak meter can also be defined here. Unfortunately, Halo Vision does not include loudness metering and therefore no loudness history, so another plug-in is required for loudness measurements. For this purpose, we recommend VisLM from the Nugen Audio Loudness Toolkit, for example.
The Spectrum Module offers FFT spectral analysis and, as usual, displays the level of the frequencies. You can choose between Single View and Groups View. The single view shows the frequency range of all channels in a common spectrum. However, the Groups View, in which up to five different spectra are displayed simultaneously, is much more interesting for multi-channel applications.
In the Modules menu, you can select which channels are included in one of the spectras. These spectra are assigned different colors and displayed as overlays. For example, you can define a separate spectrum for the LFE to ensure that it contains only low-frequency signal components. The screenshot below shows the five spectra of L+R, Center, Surrounds + Rear Surrounds, Heights, and LFE.
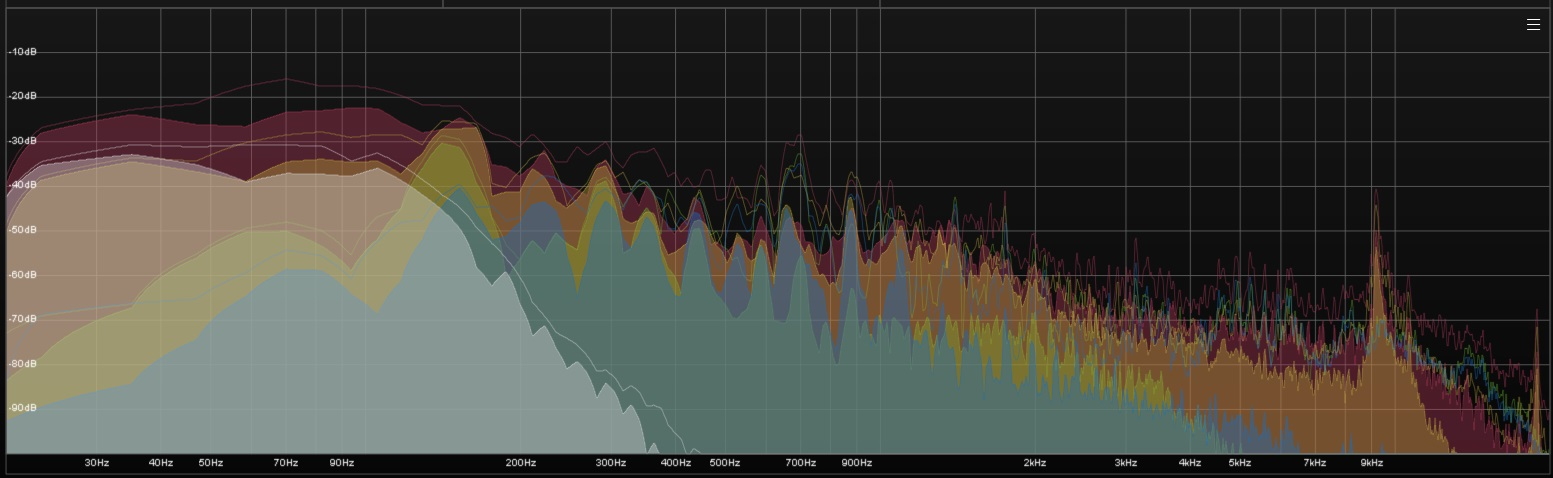
This makes it possible to visually monitor different areas simultaneously within this module. In addition, it is also possible to display multiple Spectrum Modules, in which, for example, the full spectrum, only the low frequency range, or only the high frequency range can be analyzed.
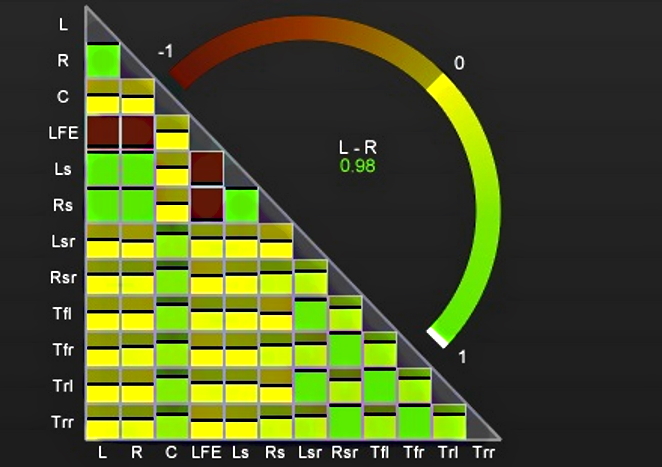
Up to this point, the modules do not differ from the usual stereo visualizations found in other analysis plug-ins. Especially for surround and 3D immersive productions, Halo Vision offers two special modules for displaying channel correlations, which consist of 66 different correlation pairs in a 7.1.4 signal.
To maintain a useful overview, there is the so-called Correlation Matrix. It displays the phase relations between all possible channel pairs in small squares. The color of the square and a horizontal black line indicate the degree of correlation, ranging from green (in phase) to yellow and orange to red (out of phase). These squares are arranged in a triangle on the X and Y axes. If the correlation falls below a user-defined threshold, the corresponding square becomes red as a warning. In addition, the correlation of a channel pair (default = L-R) is displayed in a larger area on a semicircular line, similar to a stereo correlation meter. You can use the mouse to select any pair you want to view in detail.
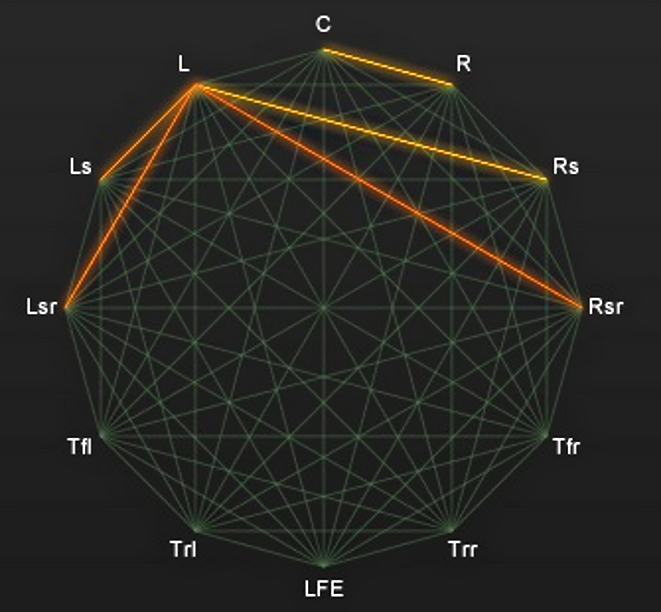
Correlation Web is the second module for displaying phase relationships. Here, the phase relationship of all channels is also displayed. For this purpose, the channels are all arranged at equal intervals on the outside of a circle and connected to each other by lines.
However, the lines between a channel pair only light up if a correlation threshold that can be defined by the user is not reached. The more out of phase the signal is, the more intense or red the line becomes. Correlation Web thus primarily displays warnings to check certain signals in the mix.
The last two modules visualize the spectral and energetic distribution of the multi-channel signal in space or in the analyzed sound field of the loudspeaker arrangement.
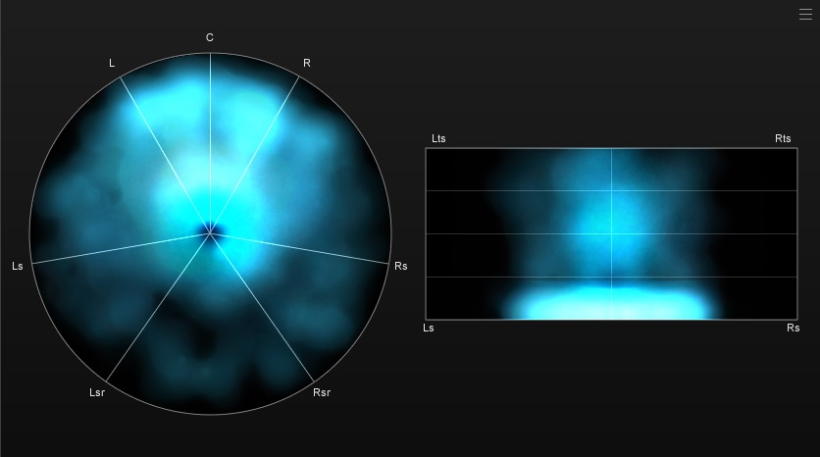
The Frequency Haze module displays the spectral content of the signal in the surround panorama, indicating the direction from which tonal information is perceived. The lowest frequencies are displayed in the center of the circle, while the highest are on the outer edge. The intensity is indicated by different colors. If a signal with overhead channels is present, Frequency Haze displays an additional (half) circle - one for the lower layer and another for the high-frequency layer. The frequency scale display can be permanently turned on or off, or it can be displayed only when the mouse is hovered over the views.
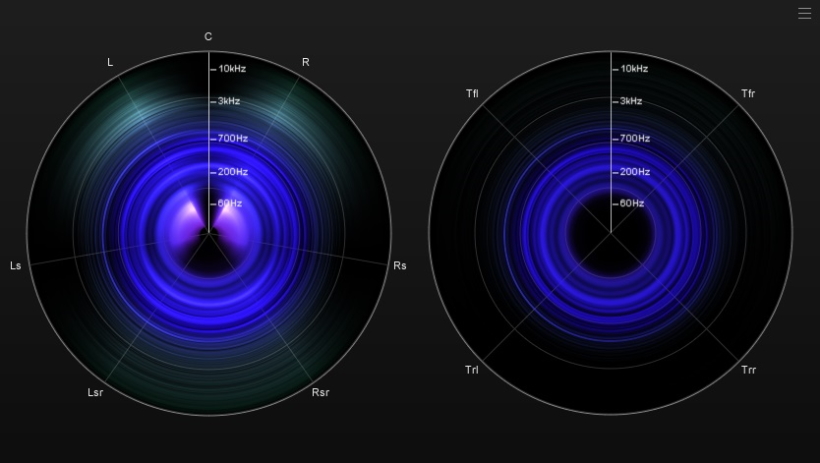
In comparison, the Location Haze module visualizes the energy distribution of the signal in a surround panorama. Brighter areas represent a higher perceived energy at this point in the room compared to darker areas. Here, too, there is a second display for channel configurations with height channels – in Location Haze, however, this is a rectangle that basically allows a view from behind into the room, displaying the height signals at the top edge and the ear level at the bottom edge of the rectangle. The circular views of the Haze module show a view of the room from above. Incidentally, Location Haze is the only module in which you cannot make individual settings.
In Practice
We tested Halo Vision in Pyramix V15 (PC, Windows 11) and Pro Tools 2024. 10.2 (Mac M2, OS 14.8.1). When using all modules (preset “All Views”), the CPU load in Pyramix 15 in a 7.1.4 master bus on an aging i9 9900K with MassCore is approximately 9% on one CPU core. In a Dolby Atmos project with a 7.1.4 master bus after a renderer in Nuendo 14, with a base load of approximately 25 percent, the load in the Nuendo performance display increased to approximately 45% due to the plug-in in the master bus on an AudioKern B14 DAW in display mode with signal.
The Spectrum Module offers great flexibility with its many display options, allowing you to freely combine your preferred signal components to be monitored in one or more modules.
For me personally, however, the Correlation Matrix is the best module in Halo Vision, as it allows you to see at a glance whether there are any critical phase relationships between individual channel pairs – these are immediately visible thanks to the orange or red color. Supplemented by the Correlation Web, you have a clear signal should there be any persistent phase problems between the channels, which you can then specifically address in the mix.
The two Haze modules are particularly helpful when working with surround and immersive formats, as they can assist with listening during mixing. However, I find it somewhat irritating that typical phantom sound sources on L+R are not displayed in the center position in Frequency Haze. Here, the levels as they appear on the individual channels are simply displayed without being calculated using neighboring signals.
This is not the case in the Location Haze module, where a signal is displayed at the front center, regardless of whether it is only on the center channel or as a phantom sound source on L+R. This center hole in Frequency Haze is clearly visible at the top of the screenshot in the low frequencies. For mixes that do not make heavy use of the center speaker, this takes some getting used to.
Of course, Halo Vision can also be used in stereo channels, although in stereo setups, both the Correlation and Haze modules do not show any more information than standard stereo correlation meters and phase scopes. It is therefore a special tool for multi-channel workflows.
As mentioned above, however, Halo Vision does not include loudness metering, which must therefore be supplemented with another plug-in if required. I would like to see a bundle of Halo Vision and VisLM from Nugen Audio.
In addition, all Nugen Audio solutions currently lack support for channel formats larger than 7.1.4. The 9.1.4 mix and monitoring format, which is often used in Atmos mixes, is therefore not supported, nor are formats with six height speakers. Even if you are actively mixing in larger setups, you can still use Halo Vision in the DAW in a 7.1.4 channel, into which you route a 7.1.4 live re-render from the Atmos renderer. As soon as you start working with object-based formats such as Dolby Atmos, loudness metering and visualization must be done in a self-selected or predefined monitoring format anyway. However, it would be helpful if the correlation of all possible monitoring formats up to 9.1.6 could be displayed.
Conclusion
Provided that the exclusive plug-in concept does not restrict its use, Nugen Halo Vision is a very helpful tool, especially for multi-channel productions - and even when used with a simple host on a second computer, it is significantly cheaper and more flexible than most hardware-based analyzers/visualizers.
Nugen Halo Vision can be purchased from the manufacturer's website, Nugen Audio, or from the usual retailers. Nugen Halo Vision as a single plug-in costs just under $300. However, it is also available as part of the Halo Suite, along with Halo Upmix and Halo Downmix, for app. $770.